RUN visual chart · surfaces · photos · history

The chart that remembers every tooth.

A tooth chart by surface, the history of every tooth, photos and X-rays attached to it. "Propose treatment" adds the service to the plan — with the tooth number, the catalog price and the KSMP code.

  • Mixed dentition · 20 conditions
  • Per-surface marking (M/D/O/B/L)
  • Per-tooth history
  • "Propose treatment" → plan
  • Photo + X-ray attach

What's in the clinical chart.

Five capability cards. Built for dentists who don't want to "type filling into the form" anymore.

Per-surface

Per-surface marking (M/D/O/B/L)

Mesial, distal, occlusal (incisal on front teeth), buccal and lingual — for caries, filling, fracture and calculus each surface is marked separately. The legend has 20 conditions, each with its own colour — from caries, pulpitis and periapical lesion to post, bridge retainer and splint. Mobility (grade 1–3) is a separate field.

KSMP

Code and price from the service

"Propose treatment" shows recommended services for the marked condition. Every service in the catalog carries its KSMP code and the price from the clinic's price list — you enter them once. In the visit, the "ICD-10 diagnosis" is picked for every activity, with the official code names.

Photos · X-rays

Photo + X-ray attachments

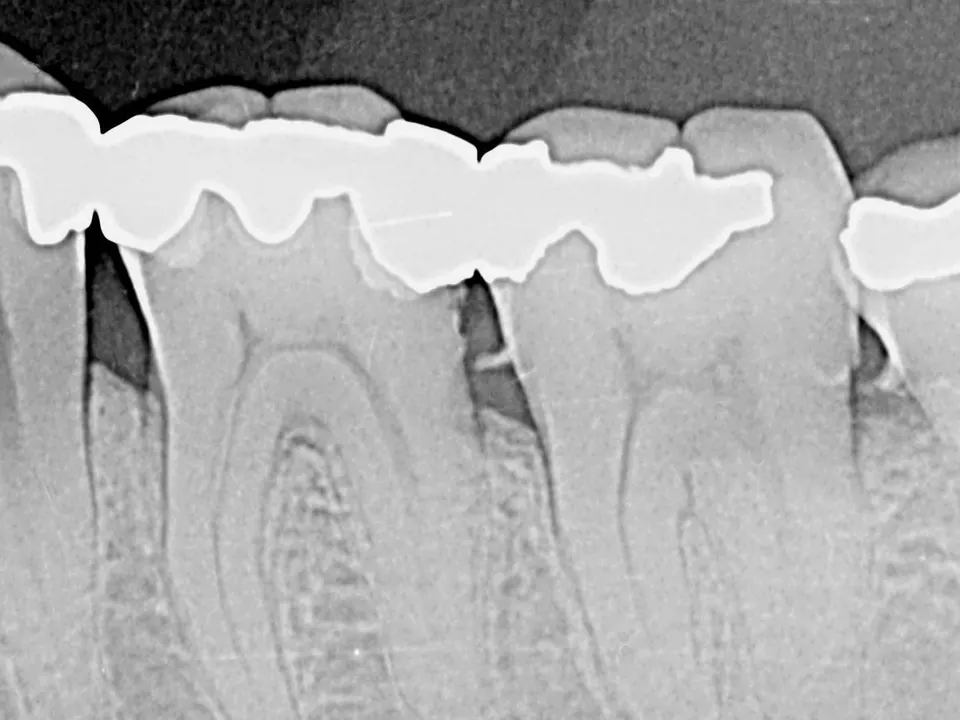
In "Imaging" you click "Upload image" and mark the teeth in "Teeth (FDI)" and the capture date. The image appears in the "Images" panel of each of those teeth. The viewer zooms, pans and rotates it, and "Download" saves it. Files up to 10 MB.

History

Multi-doctor edit history

Every change to a tooth has an author and a time — you see them in the tooth's history in the inspector. Changes also go into the clinic's action log. For a second opinion, for the colleague at the next visit.

Plan

Straight to the treatment plan

From the tooth inspector, "Propose treatment" adds the service to the active treatment plan or starts a new one. There you arrange it into priced phases. From chart to plan — no re-entry.

In the app

The whole mouth on one screen

Permanent and primary teeth, 20 CL107 conditions and mobility. Every tooth opens with one click.

Why we exist

A tooth chart on paper. Or in Excel. Or in a form from 1998.

Many dental systems give you a form with text fields: "21: filling", "16: caries". No visual context, no history, no link to a treatment plan. A lot of typing per chart entry.

Form-based / paper chart
  • Text fields for every tooth · a lot of typing

  • No visual representation · hard to explain to a patient

  • History lives in other folders · no quick access

  • NHIF codes entered manually from memory

  • Multi-doctor — who wrote what? No trace

DentaFlow visual chart
  • Mark the surface · one click

  • Visual chart · show the patient immediately

  • History per tooth · click → every past change

  • Code and price come from the service in the catalog

  • Edit history · who changed what and when

Workflow

From exam to treatment plan.

Four steps from a patient in the chair to a treatment plan you show the patient. No text fields, no code lookup, no re-entry.

  1. 01
    01 · Open

    Open the chart

    One click from the patient profile — the chart sits right below the stats. It shows the permanent teeth plus the primary-tooth rows (mixed dentition), with FDI numbering.

  2. 02
    02 · Mark

    Mark it in the tooth panel

    Click the tooth and its panel opens on the right. Pick the condition — caries, filling, crown, implant, missing tooth and more — and press "Apply". For caries, filling, fracture and calculus you also mark the individual surfaces (M, O, D, B, L). The full chart reads at a glance.

  3. 03
    03 · Treatment

    Propose treatment

    Click the tooth — the inspector opens with its history, photos and a "Propose treatment" button. It shows recommended services for the marked condition, or you search the whole catalog. The code and price come from the service.

  4. 04
    04 · Plan

    Add to plan

    The service goes into the active treatment plan or starts a new one. There you arrange it into priced phases and present the plan to the patient — who accepts it in the portal.

Built for

Real clinical work, not form-based legacy.

A tooth chart that works in the real world means instant visual feedback, a history of every change, and the images kept with the tooth. Four pillars that make this dependable.

Instant marking

Real-time

Per-surface marking shows at once and is saved per tooth. Works in the browser on a computer or tablet — no install.

History and action log

Action log

Every change to a tooth records author and time in the tooth's history and goes into the action log the admin sees. The log is append-only; retention is configurable (1 year by default). Data is stored in the EU (Ireland).

Photos and X-rays per tooth

Photos

X-rays and photos with a capture date, tagged with a tooth number. They appear in the tooth's inspector and download in one click.

Print and portal

Portal

The chart prints as a table of findings per tooth. The patient sees the same chart in their portal — view only.

The NHIS ambulatory sheet (D001) — with tooth and surfaces for every procedure — is submitted by DentaFlow and gets an NRN.
Comparisons

Comparing with another system?

Each vendor has its own page with the date we checked it and a source for every fact.

FAQ

Frequently asked questions.

Six questions we always get about the clinical chart.

Does the chart work on a tablet?

Yes. DentaFlow runs in the browser on a computer, tablet or phone, with no install. Tap the tooth, pick the condition in its panel and press "Apply". On a computer you use the mouse.

Where does the procedure code come from?

From the service. "Propose treatment" in the tooth inspector shows recommended services for the marked condition, and you can also search the whole catalog. Every service carries its KSMP code and the price from the clinic's price list. The code isn't guessed from the colour — the doctor picks the service.

Can we bring over existing charts and X-rays?

Patients import from CSV or Excel, with duplicate checks by EGN. Old charts don't transfer automatically — the doctor marks the current state at the first visit. X-rays and photos go into the patient's documents, tagged with a tooth number.

What else can I record for a tooth?

Mobility (grade 1–3) and free-text notes. Every change goes into the tooth's history with author and time. The chart prints as a table of findings, and the patient sees it in their portal — view only.

Multi-doctor — can I see who marked what?

Yes. Every change to a tooth is saved with its author and time — you see them in the tooth's history. Changes also go into the action log the admin reviews.

Can we export our data if we decide to switch?

Yes. The admin downloads a ZIP archive of the clinic's data — patients, appointments, treatments, invoices and more — at any time. The website stays yours.

Next step

Ready to leave the form-based chart behind?

15 minutes. We show you the tooth chart on sample data — from marking to the treatment plan. No obligation.