Analytics
This guide shows how to read the Analytics page — the KPI cards, the 12-month trend chart and per-doctor performance. The page is available to the whole team, but what you actually see depends on your role. The app screenshots show the Bulgarian interface; every label below gives the Bulgarian original in parentheses.
At a glance
- Three tabs: Overview (Преглед), Patients (Пациенти) and Team (Екип) — the last one is hidden entirely for Front Desk.
- Revenue figures render only for Admin, or for every role once Revenue Visible to Staff (Видими приходи за персонал) is turned on under Modules. “Revenue” is the sum of paid treatments, not of issued invoices.
- On Overview and Team, a Doctor login only sees their own patients, appointments and treatments. The Patients tab covers the whole clinic’s patients.
- Switch the reporting period with This Week (Тази седмица), This Month (Този месец), All Time (Цялото време); they aren’t shown on the Patients tab.
- Export CSV (Експорт CSV) downloads the data of the current tab — what each file contains is described in the FAQ below.
Reading the dashboard
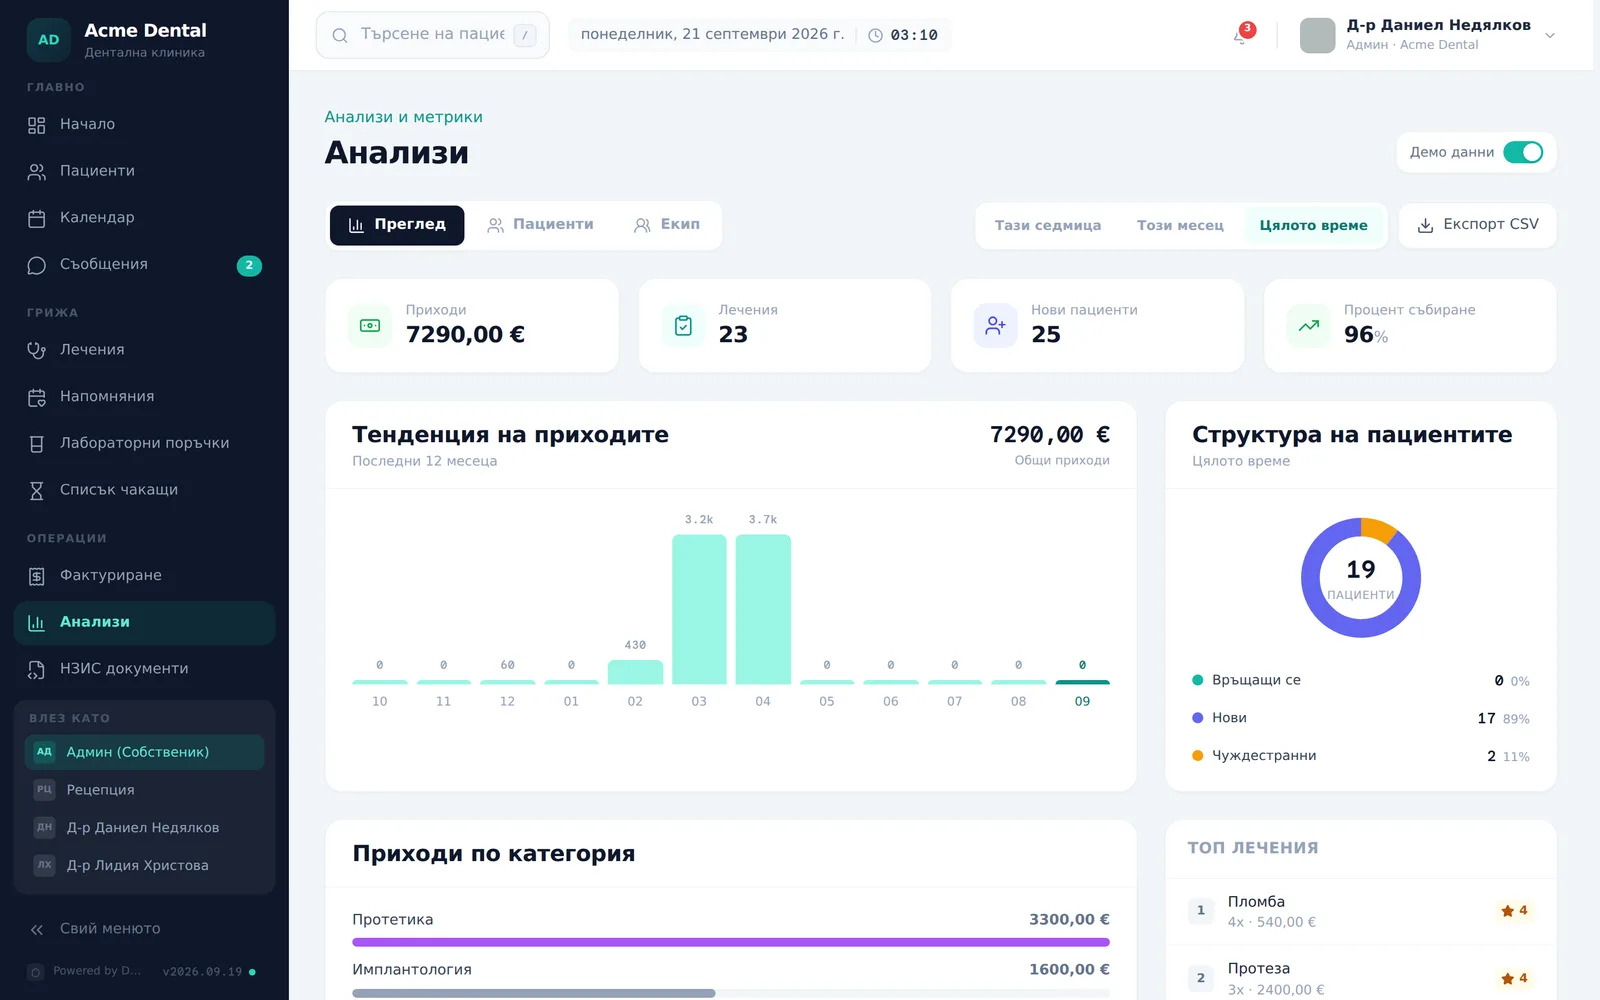
- Open Analytics (Анализи) from the sidebar and pick a tab: Overview (Преглед), Patients (Пациенти) or Team (Екип) (the Team tab is visible only to Admin and Doctor).
- Use This Week (Тази седмица) / This Month (Този месец) / All Time (Цялото време) at the top right to change the reporting period for Overview and Team. “This Week” is the last 7 days up to today.
- The KPI cards on Overview are Revenue („Приходи“), Treatments („Лечения“), New Patients („Нови пациенти“) and Collection Rate („Процент събиране“, paid versus all treatments in the period). Next to each card, a trend chip (green up-arrow / red down-arrow with a %) shows the change versus last week or last month; with All Time there is no comparison.
- The Revenue trend („Тенденция на приходите“) chart shows monthly bars for the last 12 months and doesn’t depend on the selected period. Below it are Patient mix („Структура на пациентите“: new, returning, foreign), Revenue by Category („Приходи по категория“), Top Treatments („Топ лечения“) and Upcoming Capacity („Натовареност напред“) — appointments booked for the next 5 days.
- Without visible revenue (a Doctor or Front Desk with the toggle off) only Treatments and New Patients remain, and the charts are called Treatment volume („Обем на лечения“) and Treatments by Category („Лечения по категория“) and show counts instead of amounts.
- Click Export CSV (Експорт CSV) to download the current tab’s data.

The Patients tab
The Patients (Пациенти) tab covers the whole clinic and doesn’t depend on the period. It shows Patient Retention („Задържане на пациенти“: Active „Активни“, Overdue „Просрочени“ and Inactive „Неактивни“; Overdue means active patients with an overdue recall), Patient Acquisition („Привличане на пациенти“, registrations by month), Age Demographics („Възрастова структура“), Foreign patients („Чуждестранни пациенти“) by country, Lapsed patients („Прекъснали пациенти“, no visit in 6+ months) and Treatment-plan acceptance („Приемане на плановете за лечение“: discussed, accepted, rejected and lapsed — no decision for 60+ days). Outstanding Balances („Дължими суми“, patients with unpaid treatments) shows only when revenue is visible.
The Team tab
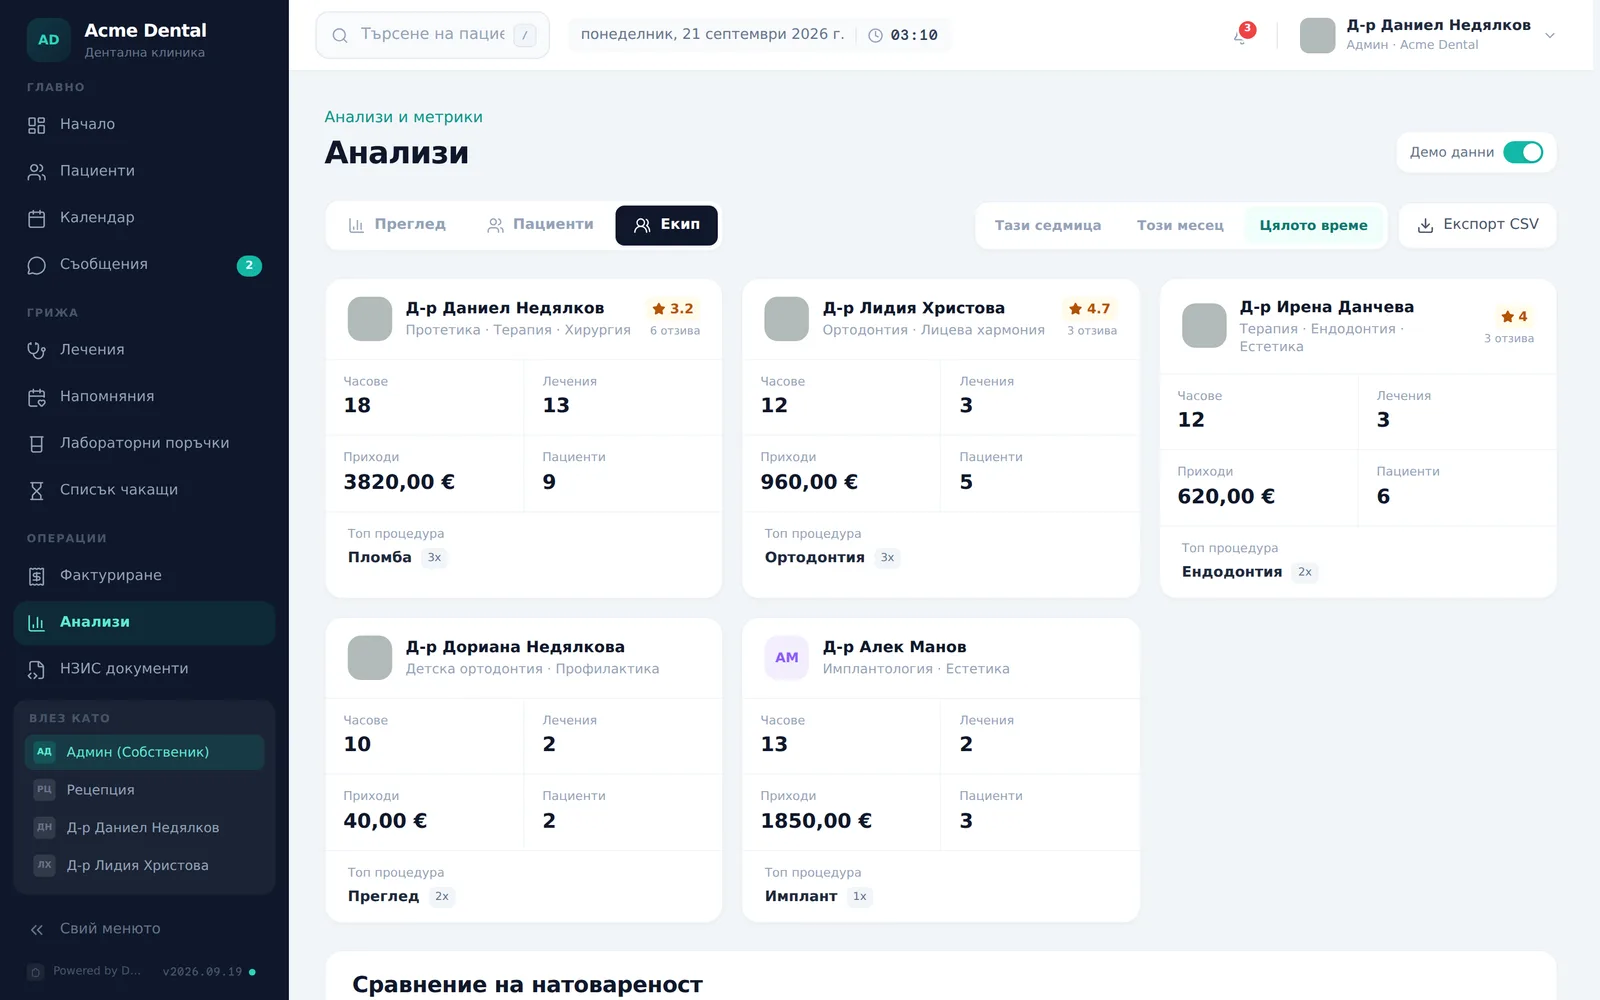
The Team (Екип) tab shows one card per doctor: Appointments („Часове“), Treatments („Лечения“), Revenue („Приходи“, only when revenue is visible), Patients („Пациенти“), Top procedure („Топ процедура“) and the average rating with the number of reviews. Below, Utilization Comparison („Сравнение на натовареност“) ranks doctors by number of appointments in the period (the busiest is 100%). It is hidden entirely for the Front Desk role; a Doctor only sees their own card.
Frequently asked questions
Why don’t I see revenue numbers as Front Desk or Doctor? Revenue cards and charts render only for Admin, unless an Admin has turned on Revenue Visible to Staff (Видими приходи за персонал) under Settings → Modules. Without that toggle, other roles see treatment counts instead of currency amounts in the same charts.
Can a Doctor see clinic-wide numbers? Not on Overview and Team: a Doctor login only sees their own patients, appointments and treatments. The Patients tab, however, is calculated over the whole clinic’s patients.
Does Front Desk see the Team tab? No, it’s hidden entirely for that role.
What period does the trend chart cover? The last 12 months — inspect the monthly bars directly on the chart.
What exactly is in the CSV export? It depends on the tab you’re on. The column headings in the file are in English.
- Overview — the period’s headline figures (including the
Revenue (paid)andCollection rate %rows), the 12-month trend and top treatments. Without visible revenue, the trend is in treatment counts and the revenue column of top treatments is empty. - Patients — a list of the clinic’s patients: name, phone, email, status, country, registration date, last visit and outstanding balance. It doesn’t depend on the selected period and isn’t limited to one doctor’s patients.
- Team — one row per doctor with appointments, treatments, patients, top procedure, utilization and ratings; the revenue column is empty without visible revenue.
The file contains patients’ personal data — keep it safe and share it only when needed.